Android Breakpoints
本文主要试图回答一个问题:Dalvik VM是如何实现断点的?先对Android应用程序调试模型和JDWP协议进行了简要介绍,然后从源码分析的角度,说明了断点的实现过程。
1. Android App的调试模型
对Android应用的调试属于远程调试,被调试的app进程和调试器进程运行分别运行在不同的系统中。adb,如其名Android Debug Bridge,在调试的过程中扮演了“桥梁”的角色。下图说明了Android应用程序的调试模型。
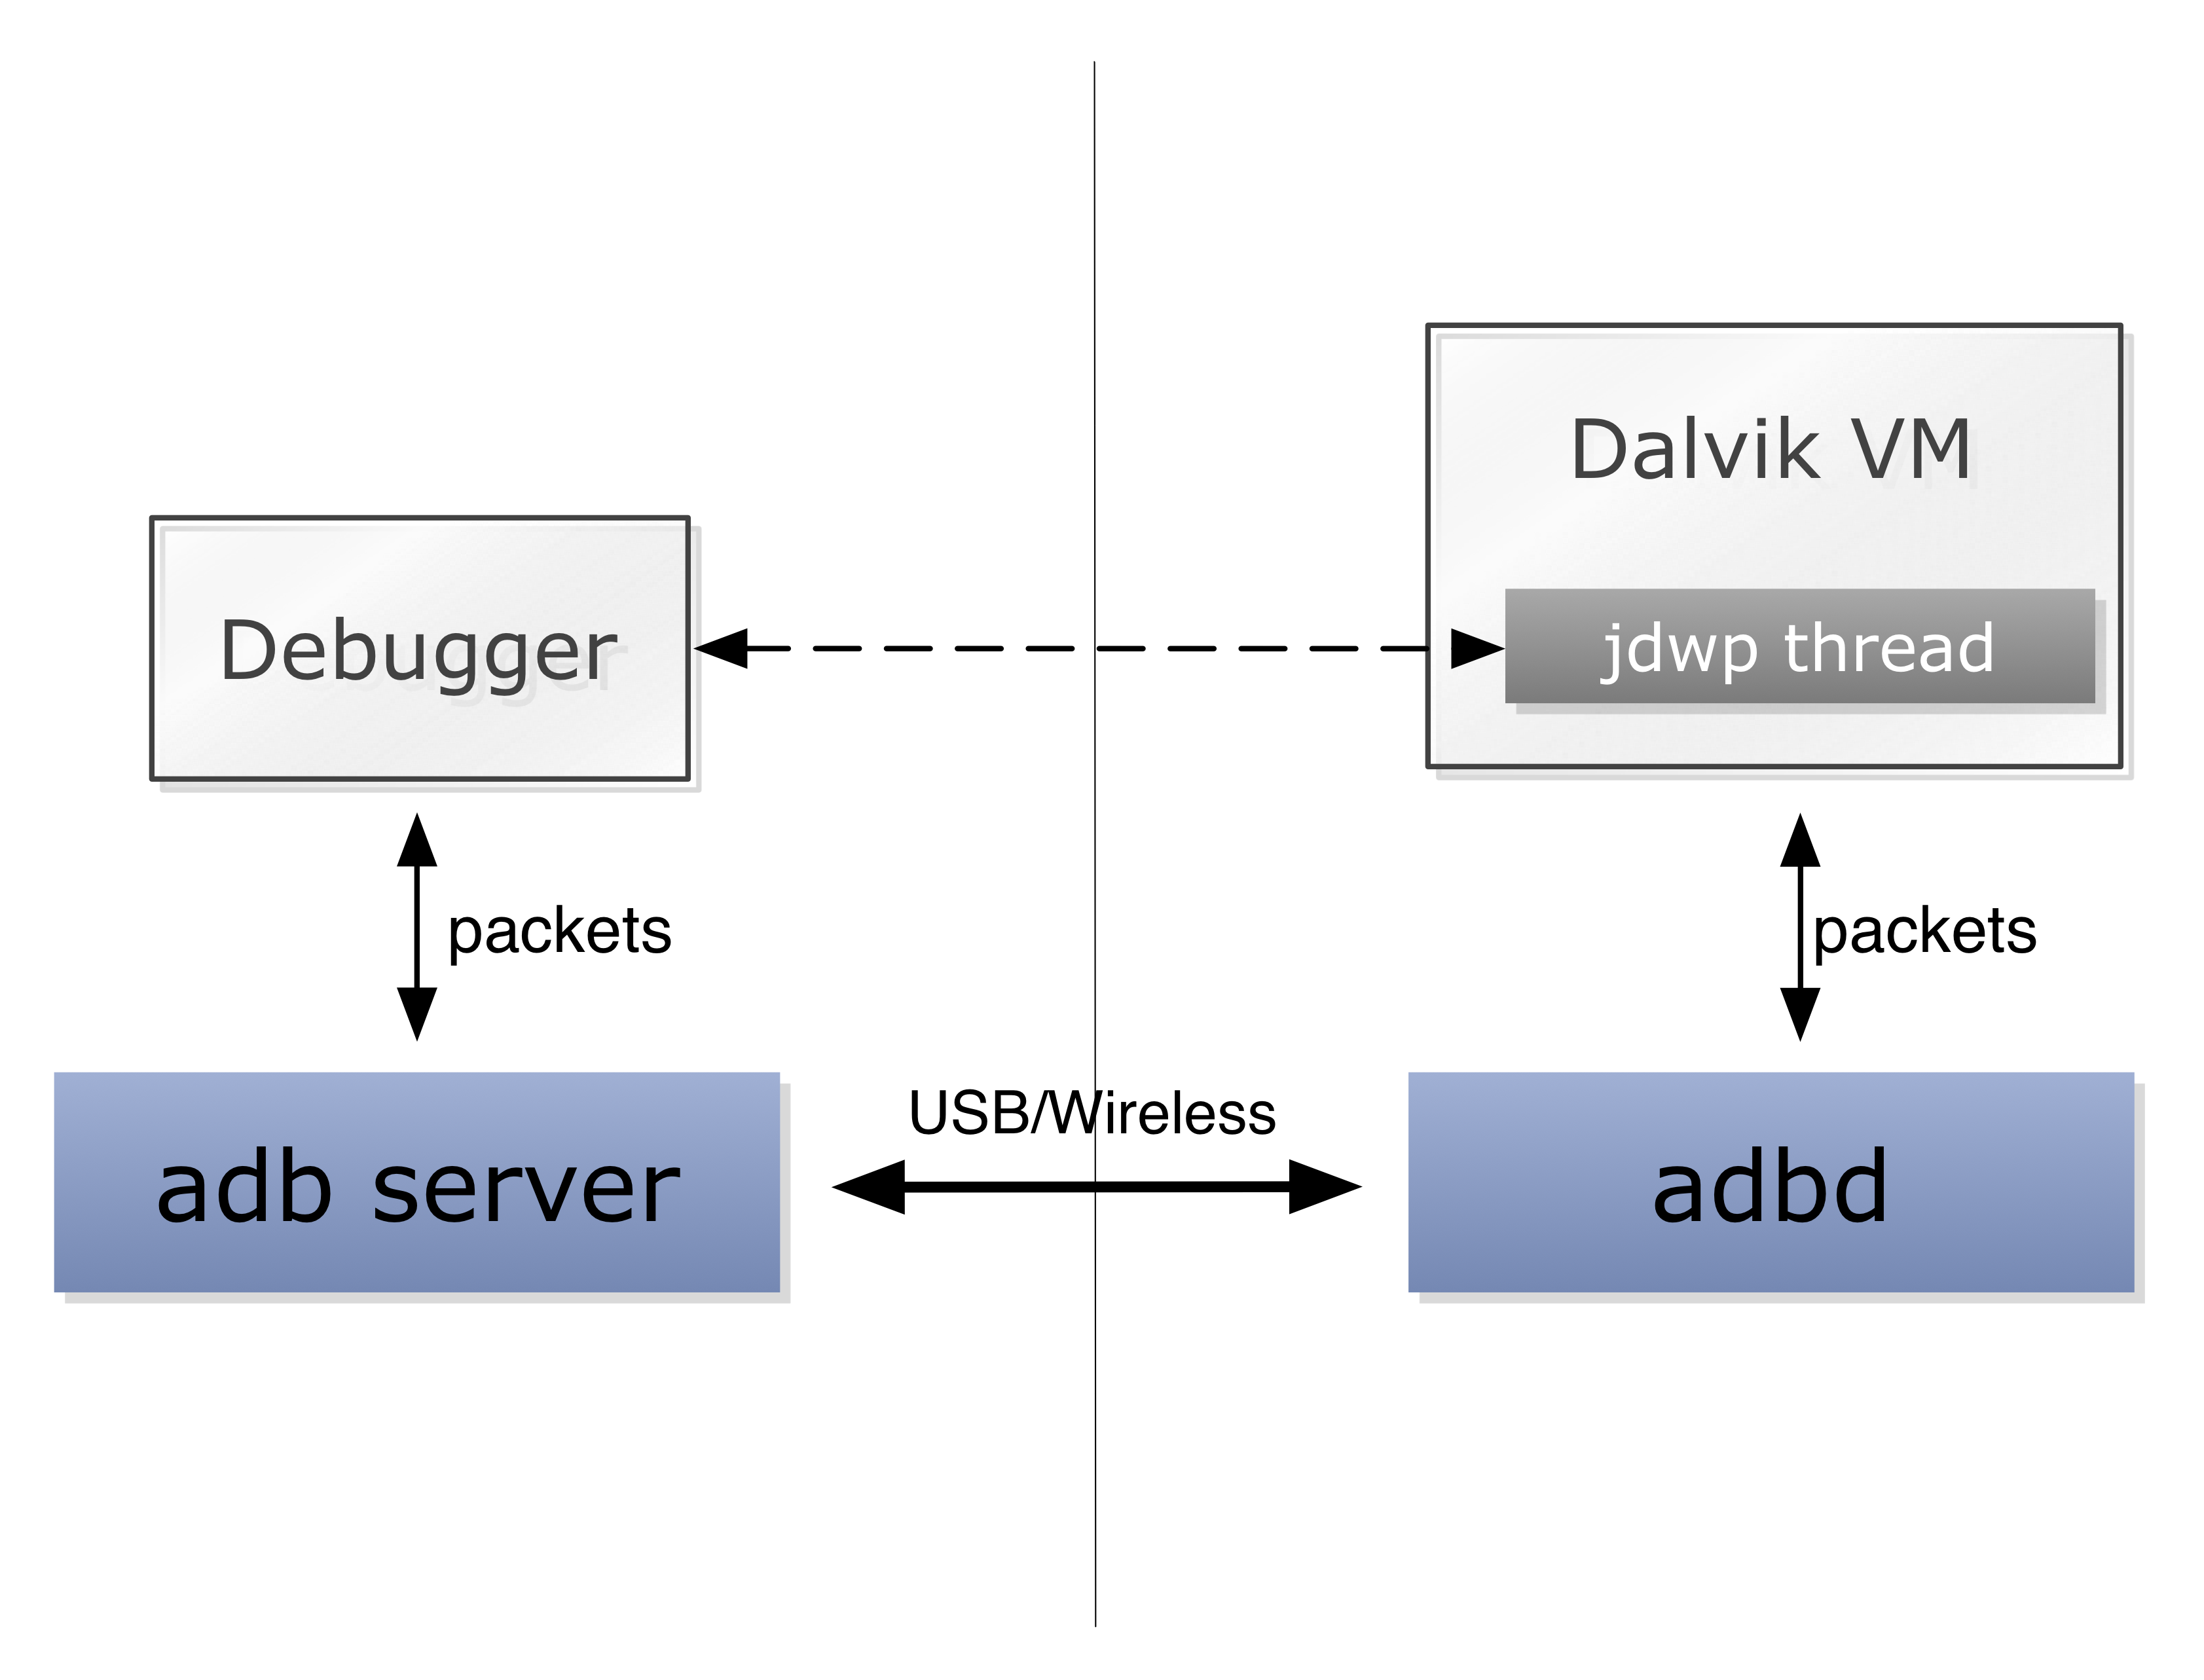
运行在PC上的adb server和运行在Android设备/模拟器中的adbd守护进程通过USB或者无线网络建立连接,分别负责与Debugger和app的Dalvik VM进行通信。更准确地说,每个Dalvik VM中,都有一个jdwp线程负责处理调试器发来的执行调试命令,Debugger实际上是与jdwp线程进行通信。
一旦连接建立起来,Debugger与Dalvik VM通过“桥梁”进行调试数据的交换,adb server和adbd对他们来说就是透明的了。
2. JDWP
同Java VM一样,Dalvik VM使用的也是JDWP(Java Debug Wire Protocal)协议,通信数据以jdwp packet为单位。Debugger发送调试命令格式为Command Packet,格式为:
- Header
- length (4 bytes)
- id (4 bytes)
- flags (1 byte)
- command set (1 byte)
- command (1byte)
- data (Variable)
VM返回的数据Reply Packet格式为:
- Header
- length (4bytes)
- id (4 bytes)
- flags (1 byte)
- error code (2 bytes)
- data (Variable)
Command Packet和Reply Packet都是由头部+数据组成的,头部大小固定,而数据大小是可变的。数据的类型与Command Packet的command set和command两个变量有关,具体可以参考JDWP文档的协议部分。
JDWP中有一个特殊的命令集(Command Set),EventRequest Command Set:Debugger发送一个event request给VM,request中对事件进行了具体的描述;在VM运行过程中,当Debugger请求的事件发生时,VM会把事件相关的数据返回给Debugger。
3. Breakpoints
下面以断点为例 说明Dalvik VM的处理过程,从Debugger发送请求直到断点设置完成。
3.1 Event Request
首先,Debugger会发送一个event request,这个request的格式为:
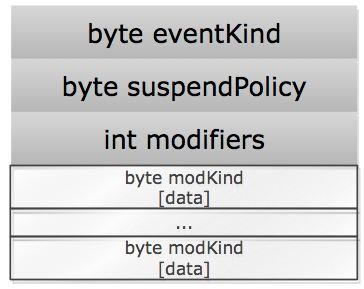
对于断点来说,eventKind为BREAKPOINT,suspendPolicy指的是断点发生时程序暂停的方式(仅暂停当前线程还是暂停所有线程),modifiers为Modifier的个数——一个event request可以包含0个或者更多个Modifier。
Modifier可以看做是event的属性,当event较为复杂时就需要多个Modifier进行描述。Modifier包含modKind和data,data部分根据modKind的不同,类型有所区别。它的定义在platform_dalvik/vm/jdwp/JdwpEvent.h,是一个联合体结构:
/*
 * Event modifiers.  A JdwpEvent may have zero or more of these.
 */
union JdwpEventMod {
   	u1      modKind;                /* JdwpModKind */
   	...
   	struct {
       	u1          modKind;
       	JdwpLocation loc;
   	} locationOnly;
   	...
}; 比如,对于一个在指定位置(地址)处的断点,data部分为JdwpLocation类型。JdwpLocation类型在platform_dalvik/vm/jdwp/Jdwp.h中定义:
struct JdwpLocation {
	u1          typeTag;        /* class or interface? */
	RefTypeId   classId;        /* method->clazz */
	MethodId    methodId;       /* method in which "idx" resides */
	u8          idx;            /* relative index into code block */
};
实际上,在指定位置处下断点的一个event request,最终可以描述为:
- eventKind: BREAKPOINT
- suspendPolicy: SP_THREAD
- modifiers: 1
- modKind: MK_LOCATION_ONLY
- JdwpLocation:
- typeTag
- classId
- classId
- idx
3.2 处理断点请求
Dalvik VM的jdwp线程对event request处理过程在platform_dalvik/vm/jdwp/JdwpHandler.cpp中的handleER_Set函数中完成:
static JdwpError handleER_Set(JdwpState* state,
   	const u1* buf, int dataLen, ExpandBuf* pReply)
{
   	const u1* origBuf = buf;

	// 读取顺序与前文中对event request的说明一致
   	u1 eventKind = read1(&buf);
   	u1 suspendPolicy = read1(&buf);
   	u4 modifierCount = read4BE(&buf);

	...

   	// 初始化一个JdwpEvent,描述事件
   	JdwpEvent* pEvent = dvmJdwpEventAlloc(modifierCount);
   	pEvent->eventKind = static_cast<JdwpEventKind>(eventKind);
   	pEvent->suspendPolicy = static_cast<JdwpSuspendPolicy>(suspendPolicy);
   	pEvent->modCount = modifierCount;

   	// 按顺序读取modifiers
   	for (u4 idx = 0; idx < modifierCount; idx++) {
       	u1 modKind = read1(&buf);

       	pEvent->mods[idx].modKind = modKind;

       	switch (modKind) {
			...
			case MK_LOCATION_ONLY: // 位置断点
			{
               	JdwpLocation loc;
               	// 读取断点位置
               	jdwpReadLocation(&buf, &loc);
               	pEvent->mods[idx].locationOnly.loc = loc;
           	}
           	break;
           	...
		}
	}

	// 注测event
   	JdwpError err = dvmJdwpRegisterEvent(state, pEvent);
   	...
}注册事件的代码在platform_dalvik/vm/jdwp/JdwpEvent.cpp中:
JdwpError dvmJdwpRegisterEvent(JdwpState* state, JdwpEvent* pEvent)
{
	...

    for (int i = 0; i < pEvent->modCount; i++) {
        const JdwpEventMod* pMod = &pEvent->mods[i];

        if (pMod->modKind == MK_LOCATION_ONLY) {
            // 告诉Dalvik VM“监视”相应位置
            dvmDbgWatchLocation(&pMod->locationOnly.loc);
        }
        ...
    }

	// 将event插入事件链表中
	// 双向链表,头插法
    if (state->eventList != NULL) {
        pEvent->next = state->eventList;
        state->eventList->prev = pEvent;
    }

    state->eventList = pEvent;
    state->numEvents++;
	...
}dvmDbgWatchLocation函数在platform_dalvik/vm/Debugger.cpp文件中,过程比较简单:
bool dvmDbgWatchLocation(const JdwpLocation* pLoc)
{
	// 从method ID构造Method对象
    Method* method = methodIdToMethod(pLoc->classId, pLoc->methodId);
    assert(!dvmIsNativeMethod(method));
    // 在method对象的idx偏移处添加断点
    dvmAddBreakAddr(method, pLoc->idx);
    return true;        /* assume success */
}
接下来代码到了Dalvik VM解释器部分的实现中,platform_dalvik/vm/interp/interp.cpp:
void dvmAddBreakAddr(Method* method, unsigned int instrOffset)
{
	// 有一个全局的断点集合
    BreakpointSet* pSet = gDvm.breakpointSet;
    dvmBreakpointSetLock(pSet);
    // 上一个函数中传进来的pLoc->idx改名为instrOffset
    dvmBreakpointSetAdd(pSet, method, instrOffset);
    dvmBreakpointSetUnlock(pSet);
}继续看同一文件中dvmBreakpointSetAdd的实现:
static bool dvmBreakpointSetAdd(BreakpointSet* pSet, Method* method,
    unsigned int instrOffset)
{
	// vector每次增长的大小为10
    const int kBreakpointGrowth = 10;
    // 计算断点的绝对地址,方法地址+偏移
    const u2* addr = method->insns + instrOffset;

    // 目标位置处是否已经存在断点
    int idx = dvmBreakpointSetFind(pSet, addr);
    Breakpoint* pBreak;

    if (idx < 0) { // 没有断点
        if (pSet->count == pSet->alloc) { // vector空间不够,开辟新空间
            int newSize = pSet->alloc + kBreakpointGrowth;
            Breakpoint* newVec;

            newVec = (Breakpoint*)realloc(pSet->breakpoints,
            	newSize * sizeof(Breakpoint));
            if (newVec == NULL)
                return false;

            pSet->breakpoints = newVec;
            pSet->alloc = newSize;
        }

		// 构造Breakpoint结构
		// Breakpoint结构体在当前文件定义
        pBreak = &pSet->breakpoints[pSet->count++];
        pBreak->method = method;
        pBreak->addr = (u2*)addr;
        pBreak->originalOpcode = *(u1*)addr;
        pBreak->setCount = 1;

        // 改opcode
        assert(*(u1*)addr != OP_BREAKPOINT);

        // VM不会执行未验证的(unverified)的代码
        // 所以如果类未被验证,不用插入断点
        if (dvmIsClassVerified(method->clazz)) {
            if (instructionIsMagicNop(addr)) {
            	// If it's a "magic" NOP, indicating the
            	// start of switch or array data in
            	// the instruction stream,
            	// we don't want to set a breakpoint.
            } else {
                ANDROID_MEMBAR_FULL(); // ??
				// 将addr处的opcode改为OP_BREAKPOINT,即0xec
                dvmDexChangeDex1(method->clazz->pDvmDex, (u1*)addr,
                    OP_BREAKPOINT);
            }
        } else {
            ALOGV("Class %s NOT verified, deferring breakpoint at %p",
                method->clazz->descriptor, addr);
        }
    } else {
        /*
         * Breakpoint already exists, just increase the count.
         */
        pBreak = &pSet->breakpoints[idx];
        pBreak->setCount++;
    }

    return true;
}最后进行opcode的修改,在platform_dalvik/vm/DvmDex.cpp中:
bool dvmDexChangeDex1(DvmDex* pDvmDex, u1* addr, u1 newVal)
{
    if (*addr == newVal) { // 新旧值相同,不需要改
        ALOGV("+++ byte at %p is already 0x%02x", addr, newVal);
        return true;
    }

	...

    // 更改内存读写属性,默认情况下指令代码部分不可写
    // 第三个参数true表示改为可读可写
    if (sysChangeMapAccess(addr, 1, true, &pDvmDex->memMap) != 0) {
        ALOGD("NOTE: DEX page access change (->RW) failed");
        /* expected on files mounted from FAT; keep going (may crash) */
    }

    *addr = newVal; // 新opcode的值写入addr

	// 改回属性,false表示只读
    if (sysChangeMapAccess(addr, 1, false, &pDvmDex->memMap) != 0) {
        ALOGD("NOTE: DEX page access change (->RO) failed");
        /* expected on files mounted from FAT; keep going */
    }

    dvmUnlockMutex(&pDvmDex->modLock);

    return true;
}
4. 总结
从上面的分析中可见,jdwp线程对断点的处理方式与OllyDbg中的int 3断点类似。然而,Android并不是一开始就采用这种处理方式。
在Android 2.0 Dalvik部分的文档中,有这样一段话:
Because Dalvik maps bytecode into memory read-only, some common techniques are difficult to implement without allocating additional memory. For example, suppose the debugger sets a breakpoint in a method. The quick way to handle this is to insert a breakpoint instruction directly into the code. When the instruction is reached, the breakpoint handler engages. Without this, it’s necessary to perform an “is there a breakpoint here” scan. Even with some optimizations, the debug-enabled interpreter is much slower than the regular interpreter (perhaps 5x).
后来,变成了:
Pre-Froyo implementations of the Dalvik VM used read-only memory mappings for all bytecode, which made it necessary to scan for breakpoints by comparing the program counter to a set of addresses. In Froyo this was changed to allow insertion of breakpoint opcodes. This allows the VM to execute code more quickly, and does away with the hardcoded limit of 20 breakpoints.